Reporting
Problem Description
We want to translate a data graph into the text form. By doing this, we make a more human friendly interpretation of mathematical representations and we can additionally explain in native human language causes and consequences.
Model
We are using Bidirectional LSTM with dual layer of attention. One attention layer to global trend and one to value.
Examples

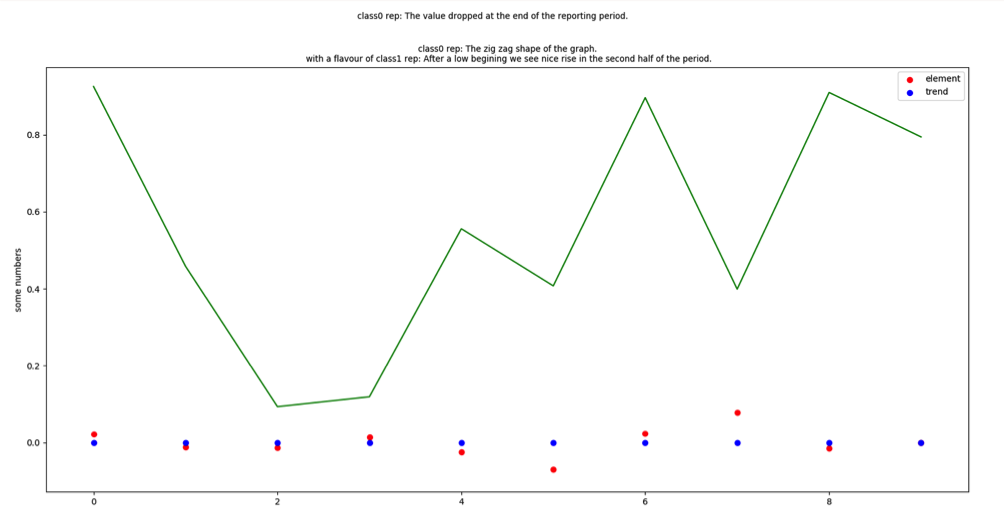
The value dropped at the end of the reporting period. After a low beginning, we see a nice rise in the second half of the period.

The value dropped at the end of the reporting period. After a high beginning, we see a drop in the second half of the period.
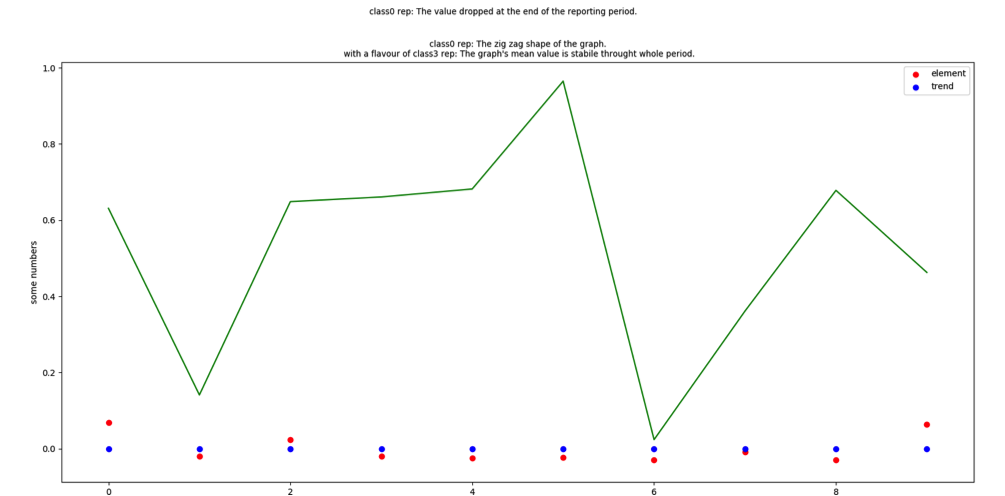
The value dropped at the end of the reporting period. The graph’s mean value is stable through whole period.
The value dropped at the end of the reporting period. After a low beginning, we see a nice rise in the second half of the period.
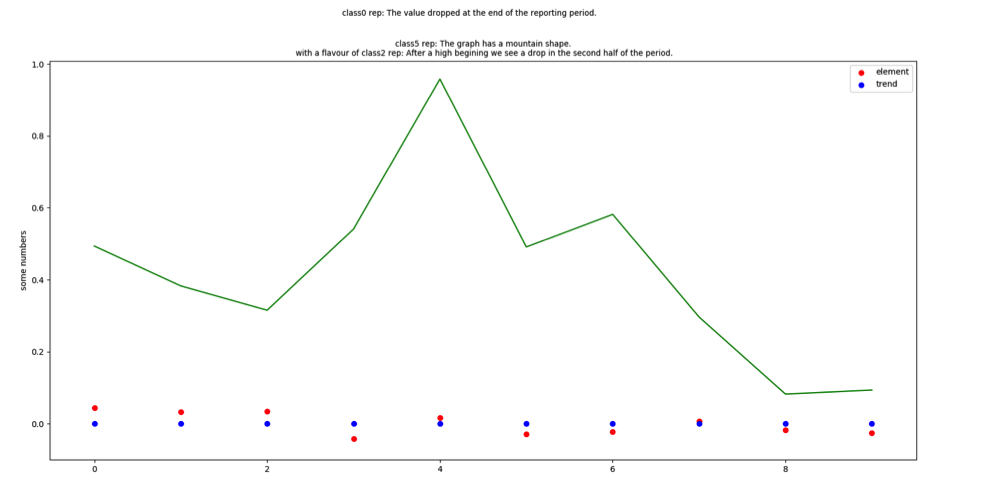
The value dropped at the end of the reporting period. The graph has a mountain shape. After a high beginning, we see drop in the second half of the period.